Mendel’s law of segregation. Genotype, phenotype, and alleles. Heterozygous/homozygous. 2 x 2 Punnett squares.
Key points:
-
Gregor Mendel studied inheritance of traits in pea plants. He proposed a model where pairs of “heritable elements,” or genes, specified traits.
-
Genes come in different versions, or alleles. A dominant allele hides a recessive allele and determines the organism’s appearance.
-
When an organism makes gametes, each gamete receives just one gene copy, which is selected randomly. This is known as the law of segregation.
-
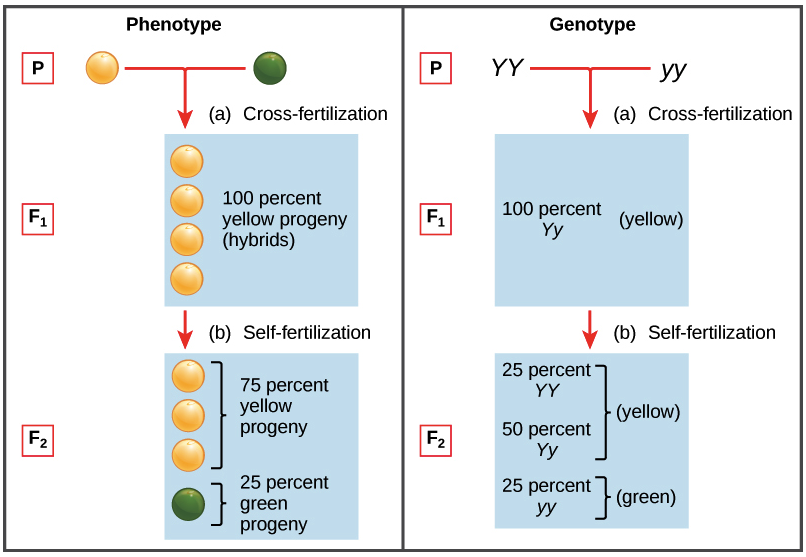
A Punnett square can be used to predict genotypes (allele combinations) and phenotypes (observable traits) of offspring from genetic crosses.
-
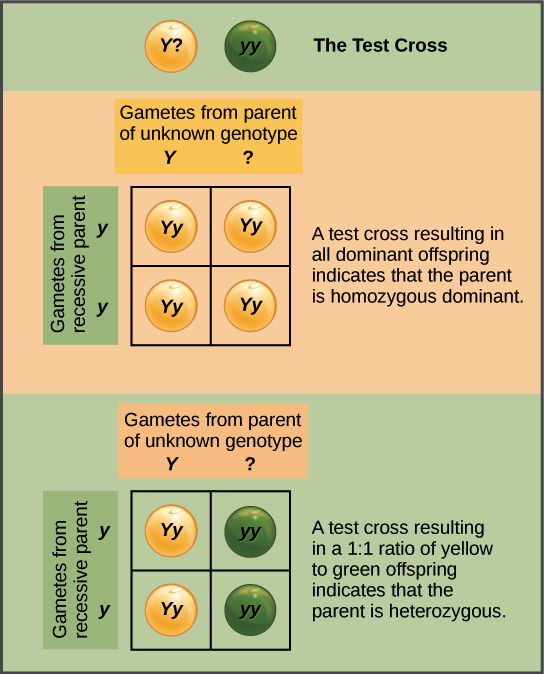
A test cross can be used to determine whether an organism with a dominant phenotype is homozygous or heterozygous.
Introduction
Mendel’s model: It started with a 3, colon, 1 ratio
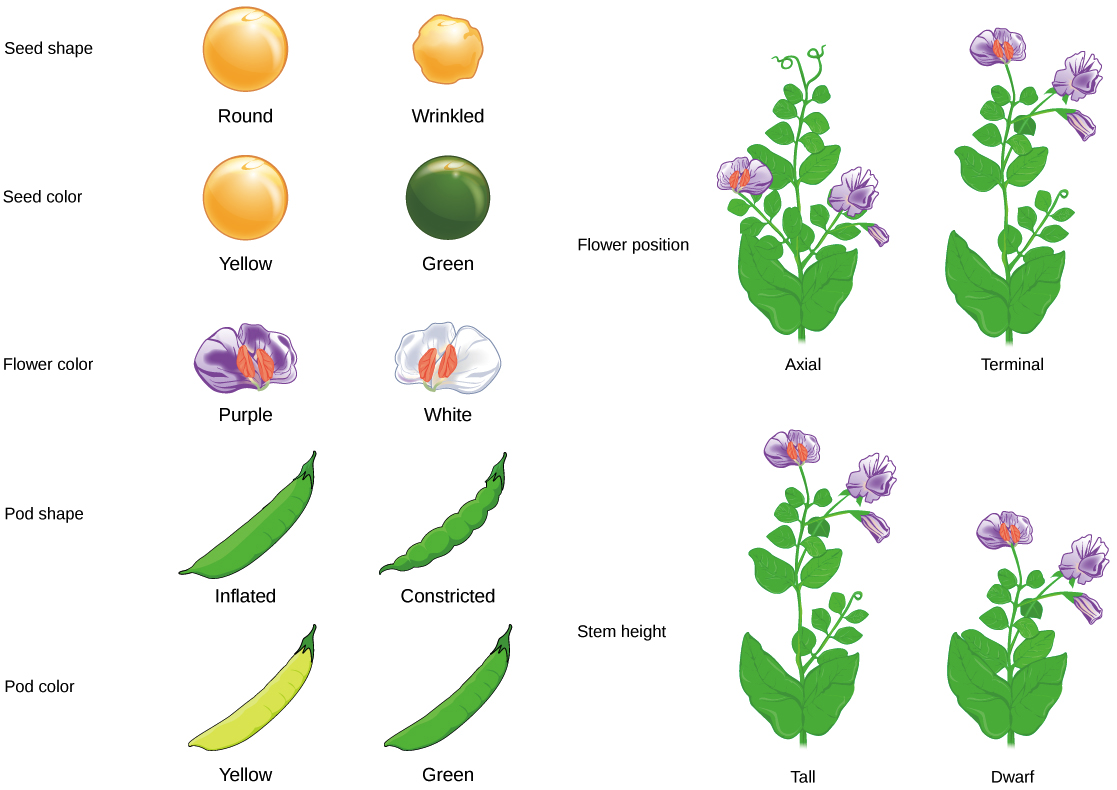
Mendel studied the genetics of pea plants, and he traced the inheritance of a variety of characteristics, including flower color, flower position, seed color, and seed shape. To do so, he started by crossing pure-breeding parent plants with different forms of a characteristic, such as violet and white flowers. Pure-breeding just means that the plant will always make more offspring like itself, when self-fertilized over many generations.
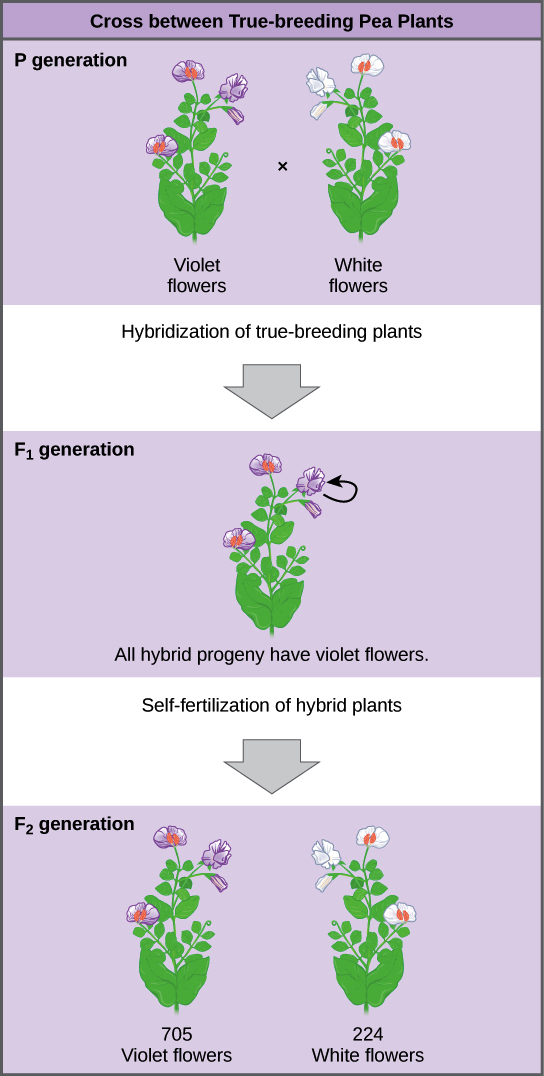
This 3, colon, 1 ratio was no fluke. For the other six characteristics that Mendel examined, both the start text, F, end text, start subscript, 1, end subscript and start text, F, end text, start subscript, 2, end subscript generations behaved in the same way they did for flower color. One of the two traits would disappear completely from the start text, F, end text, start subscript, 1, end subscript generation, only to reappear in the start text, F, end text, start subscript, 2, end subscript generation in a ratio of roughly 3, colon, 1
Mendel’s model of inheritance
Mendel’s model: The law of segregation
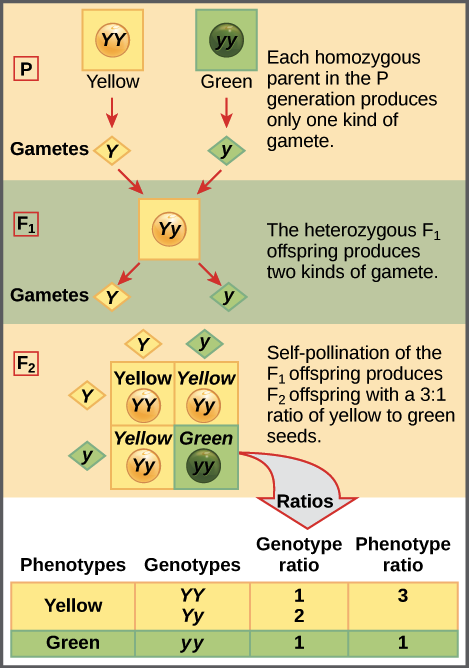
The combinations of egg and sperm are then made in the boxes in the table, representing fertilization to make new individuals. Because each square represents an equally likely event, we can determine genotype and phenotype ratios by counting the squares.
The test cross